IT Service Trends

How to Choose the Right Data Visualization

How to Choose the Right Data Visualization

Introduction to Data Visualization Data Visualisations are one of the most important components of Data analysis, as they can effectively summarise extensive data in graphical format. Several chart types are available, each having its strengths and use cases. One of the challenging aspects of the analysis process is selecting the correct way to describe your data by using any of the visualisations. While deciding the chart type, think about the role the chart will fulfil.  Common purposes for data visualisation include: Displaying change through time Representing a part-to-whole composition Illustrating flows and purposes Displaying data distribution Determining values between groups Analysing the relationship between variables Analysing geographical information Next, think about the types of data you intend to plot. The selection of chart type will depend on the data whether it will be categorical, numerical or a combination of both. Some visualisations can be used for numerous purposes depending on these criteria. This blog is organised with this concept in focus, dedicating one chapter towards each visualisation role. Each chapter includes various chart types to address common data types and subtasks.  An important note is that this document only provides general guidelines, exploring out of the standard modes might help gain additional insights. Explore not only other chart types but also the alternative methods of encoding variables in each chart. Here, the noteworthy point is that you aren’t compelled to present your information in a single plot. It’s better to maintain simplicity and be clear in each plot and use various plots to facilitate comparisons, demonstrate trends and illustrate relationships among multiple variables. How This Blog Is Organized? This blog is structured into chapters, one for each primary category for utilising data visualisations. Every chapter begins with a brief description, followed by a list of chart types that fall into that category. Each chart type is accompanied by brief introductions and some icons. Below are the keys to decoding these symbols Basic(B): Chart types accompanied by this icon represent different chart types, including standard and typical. While creating a data visualisation, try starting with one of the standard chart types before exploring uncommon or advanced options. Uncomman(U): Chat types accompanied by these icons are generally more unusual than the casual standard types. The use cases for these chart types are more specialised as compared to other chart types in the same category or more commonly used in different roles Advanced(A): Chart types with this icon are even more specialised according to their role. Ensure that the selected chart type is the most suitable for you before implementing it. Sometimes, these chart types will not be available in visualisation software or libraries requiring additional effort to assemble them. RAW NUMBERS: JUST SHOWING THE DATA It is essential to keep in mind that you don’t always need to rely on a chart to depict your data. Sometimes, presenting the data as text is the most powerful method of conveying information. Single Value Chart (B) When you only have one number, it is best to just report as it is without adding any visual information. Graphically plotting a single value (with a bar or point ) usually lacks meaning if there aren’t any other values compared to it. Single value with indicator(B) An indicator compares a value with another one, usually to evaluate a metric’s value between the current period and the previous period. Bullet Chart(B) A chart type which states the difference between a single value with another number, often a benchmark instead of another data point. Table(B) Compares data points (rows) across multiple attributes (columns). Usually sorted by a significant attribute to enhance utility. CHARTS FOR SHOWING CHANGE OVER TIME One of the most common purposes of data visualisation is to observe the variation in features or in the metric’s number value over time. Usually, these charts display time on the horizontal axis, moving from left to right, while the vertical axis represents the variable of interest’s values.  Line chart(B) The most prevalent chart type for showing changes over time is a line chart, where a point is plotted for each time period from left to right. Points are connected through line segments to depict the progression over time. Sparkline(B) A small line chart with little or no labelling, designed to be placed alongside text passages or within tables. Delivers a top-level summary without drawing too much attention.  Connected scatter plot Demonstrates change over time across two numerical values. While line segments still connect points across time, they may not go consistently from left to right, unlike in atypical line charts. Bar chart Every time period is depicted with a bar, the bar’s value is demonstrated by its height above or below a zero baseline. It works best when there are fewer time periods to show. Box plot In this format, every time period is associated with a box and whiskers, each set demonstrates the most common data values. This format excels when there are numerous recordings for each time period and a distribution of values needs to be illustrated. CHARTS FOR SHOWING PART-TO-WHOLE COMPOSITION At times, it’s not just important to know about the total, but also the composition that makes up the total. The other charts like the standard bar chart are used to compare component values, but these are the charts of the part-to-whole relationship.  Pie Chart (B) The whole value is shown as a filled circle, with each part displayed as proportional slices from that circle, each corresponding to each categorical group. It works best with five or fewer slices with each having distinct proportions. Doughnut chart (B) It is a pie chart with a hole in the centre. The central area is mainly used to depict a relevant single numeric value. But, sometimes it is also used as an alternative to a standard progress bar. Waffle chart/grid plot (U) In this squares are typically arranged in a 10*10 grid, where each square depicts one percent of the total. These squares are coloured based on the size

How to Choose the Right Data Visualization Read More »

Latest Trends in 2024

Latest AI Technologies And Trends In 2024

These are the latest AI technologies and trends widely used in 2024. Generative AI and Chatbots AI LLMs like ChatGPT, Gemini, and Bing are now becoming essential for business purposes. These LLMs assist with drafting emails, generating reports, and automation of customer service. Recently, Microsoft and Google have added these features to their chatbots to make the work quicker and easier. New LLMs like Gemini, Bing, and GPT-4 are very versatile and useful in handling different types of prompts (text, images, etc.) making it easier for the users Enhancement in Chatbots Chatbots are being enhanced and better day by day. They can perform complex tasks like Coding, personal assisting connecting with another online service, and many others. Creative art by AI AI platforms are also used in generating images, these AI platforms like Adobe Stock and Shutterstock offer tools, and create AI-based images. These platforms can produce high-quality images quickly. But these images are different from human-based art. Read more Enhanced AI LLMs LoRA(Low Rank Adaptation) helps AI models to work more efficiently by optimizing only a small part of the model. This helps in the completion of the process quickly and less resource-intensive, helping smaller companies to use powerful AI without the help of huge computing resources​. Quantization To conserve memory and expedite processing, the model quantizes its computations by decreasing their precision. Everyone may now use AI more affordably and with greater accessibility thanks to this method and LoRA (IBM, United States).​ AI Hardware and Infrastructure GPUs, or graphics processing units, are in high demand since AI models require them to function. Innovations in the development of more economical and effective hardware solutions have resulted from this. To accommodate the expanding use of AI, cloud service providers are likewise modernizing their infrastructure Regulation and Compliance Governments and regulatory agencies are enacting more stringent guidelines to guarantee the safe and ethical application of AI. To regulate the development and application of AI, for instance, the U.S. government and the European Union have proposed regulations. Businesses are also adapting to these rules to make sure they adhere to the new legal requirements (Unite.AI) AI in Software Engineering The ability to generate efficient AI inputs or prompt engineering is quickly becoming a prerequisite for software development. For developers to get the maximum performance out of AI models, they must know how to create these cues. Not just for specialists, but for many tech roles as well, this competence is now necessary (TechRepublic) AI developments in Healthcare AI is transforming healthcare by making it possible to provide more advanced preventive care, individualized therapies, and quicker, more accurate diagnoses. To identify diseases at an early stage and customize care for each patient, machine-learning algorithms examine genetic information and medical imaging. Predictive analytics powered by AI help identify patients who are at risk for early intervention, and robotic surgery improves accuracy and recuperation times. These developments offer far better patient outcomes and quality of life through more accessible, effective, and efficient healthcare. These developments demonstrate how AI is developing and influencing many facets of society and business, increasing the power and accessibility of technology but also requiring new laws and expertise.

Latest AI Technologies And Trends In 2024 Read More »

how AI is changing the rules of data analysis

How AI Is Changing The Rules Of Data Analysis

Data has become essential to corporations, governments, and organizations all around the world in the current digital era. The sheer volume, velocity, and variety of information generated every day is overwhelming traditional methods of analysis, which are straining to keep up with the exponential growth of data. Let us introduce you to artificial intelligence (AI), a revolutionary technology that is transforming the data analysis industry. We will look at how artificial intelligence is changing the game in data analysis and making it more accessible, accurate, and efficient than ever in this blog post. AI in Data Analysis AI is the umbrella term for a variety of technologies that allow computers to mimic human cognitive processes and learn from data without explicit programming. Examples of these technologies include machine learning, deep learning, and natural language processing. In the field of data analysis, artificial intelligence (AI) algorithms have the unmatched speed and precision to sort through enormous datasets, spot trends, and extract insightful information. Efficiency with Machine Learning Conventional data analysis techniques are laborious and frequently call for human intervention. AI-powered machine learning algorithms streamline the analytical process and drastically cut down on the time and effort needed to extract valuable insights from data by automating a number of tasks like feature selection, data preprocessing, and model training. Detect Hidden Patterns with Deep Learning A branch of machine learning called “deep learning” has been quite effective at revealing links and patterns in large, intricate datasets. Deep learning algorithms can detect complex patterns that may escape conventional analysis methods by employing neural networks with numerous layers of abstraction. This allows for more precise predictions and decision-making. Addressing Data Variety with Natural Language Processing Data can be found in many different formats in today’s digital world, such as text, photos, videos, and sensor data. A subfield of artificial intelligence called natural language processing (NLP) provides tools for computers to comprehend, interpret, and produce human language. Through the use of natural language processing (NLP) algorithms, businesses may examine unstructured text data from sources like emails, social media, and customer reviews. This allows them to get important insights on customer sentiment, industry trends, and new problems. AI-driven Data Visualization and Interpretation In order to communicate complex information in a way that is clear and understandable, data visualization is essential. Advanced algorithms are used by AI-powered data visualization systems to automatically create informative visuals from raw data, including graphs, charts, and heatmaps. These visualizations help decision-makers quickly recognize trends, patterns, and outliers in addition to facilitating data exploration and analysis. Challenges and Considerations in AI-driven Data Analysis Although artificial intelligence (AI) has the potential to revolutionize data analysis, there are a number of issues and concerns to be aware of. These include issues with data security and privacy, algorithmic biases, the interpretability of AI models, and the requirement for ongoing results validation and monitoring. To ensure the responsible and ethical use of AI in data, addressing these issues calls for a multifaceted strategy requiring cooperation between data scientists and the domain. Real-world Applications and Success Stories Artificial intelligence (AI)-powered data analysis is already causing waves in a number of industries, spurring innovation and providing real advantages. AI is helping businesses gain new insights, streamline operations, and gain a competitive edge in today’s data-driven economy. Examples of these applications include demand forecasting in supply chain management, personalized recommendations in e-commerce, and predictive analytics in healthcare and finance. The Future of AI in Data Analysis The use of AI in data analysis has a bright future ahead of it. We may anticipate more developments in fields like autonomous data analysis, augmented analytics, and AI-driven decision support systems as AI technologies continue to grow and develop. However, in order to overcome technological, ethical, and legal obstacles, achieving the full potential of AI in data analysis would necessitate continued research, funding, and cooperation. In summary, artificial intelligence (AI) is radically changing the rules of data analysis, enabling businesses to derive meaningful insights from data at a speed, precision, and efficiency never before possible. Businesses and decision-makers may unleash the full potential of their data assets and spur innovation in the digital age by adopting AI-driven techniques. One thing is for sure as we head into this AI-powered future: there are countless opportunities for data analysis. Read More

How AI Is Changing The Rules Of Data Analysis Read More »

Latest trends in IT Services

The Latest Trends In IT Services(2024)

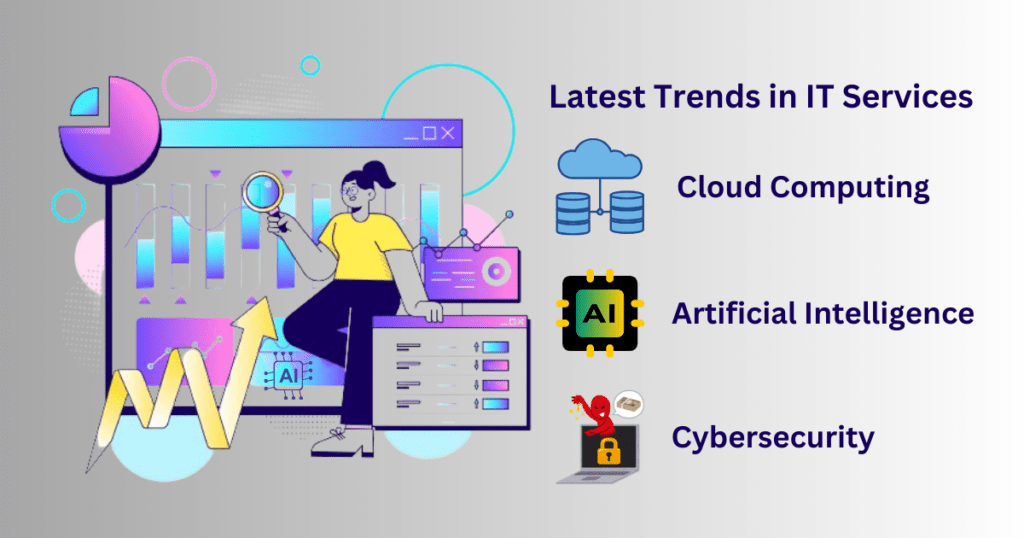
In 2024, Staying ahead of the curve is critical for IT Companies looking to retain their competitive advantage. The field of information technology (IT) services is no exception, as ongoing innovation reshapes the sector. From the rise of artificial intelligence to the growing relevance of cybersecurity, let’s look at the current trends influencing the future of IT services. Embracing Artificial Intelligence (AI) and Machine Learning (ML) These technologies are no longer just buzzwords, but essential components of current IT services. Organizations are leveraging AI and ML to automate activities, analyze data, and streamline operations. From predictive analytics to natural language processing, the possibilities are endless, transforming how organizations run and engage with their customers. Cloud Computing Continues to Soar Cloud computing has evolved from a novelty to a cornerstone of IT infrastructure. The scalability, flexibility, and cost-effectiveness of cloud solutions have made them indispensable for businesses of all sizes. Moreover, the emergence of multi-cloud and hybrid cloud environments offers unparalleled flexibility, allowing organizations to tailor their infrastructure to meet specific needs while enhancing resilience and agility. Cybersecurity Takes Center Stage With the development of cyber threats, businesses around the world have made cybersecurity a major priority. As technology evolves, so do cybercriminals’ techniques, needing effective defense mechanisms. From advanced threat detection to proactive risk management, businesses are investing extensively in cybersecurity to protect their data, systems, and reputation. Furthermore, as remote work becomes more popular, safeguarding endpoints and protecting data privacy has become increasingly important. The Rise of Edge Computing As the Internet of Things (IoT) grows and data output reaches new heights, traditional cloud infrastructure confronts issues in processing and analyzing huge amounts of data in real time. Enter edge computing, a paradigm that relocates computation and data storage closer to the point of data production. By decentralizing data processing, edge computing reduces latency, enhances scalability, and improves overall efficiency, making it ideal for applications requiring real-time insights and responsiveness. Focus on Sustainability and Green IT In response to growing concerns about environmental sustainability, organizations are increasingly focusing on Green IT projects. Organizations are working to reduce their carbon footprint while increasing resource utilization by improving data center operations and implementing energy-efficient technology. Businesses that embrace sustainable methods not only save money, but also demonstrate their commitment to corporate social responsibility. Conclusion The IT services and IT Consulting landscape is always changing, driven by rapid technical breakthroughs and shifting business needs. Organizations that embrace emerging trends and leverage cutting-edge technologies can position themselves for success in an increasingly digital world. Whether it’s harnessing the power of AI, strengthening cybersecurity defenses, or adopting sustainable practices, the future of IT services presents limitless prospects for innovation and success.

The Latest Trends In IT Services(2024) Read More »